DaDaBIK as a PHP Reports Maker
Why do we need a report maker?
If you are here, you (or your customers) need to produce reports. We produce reports, starting from our data, because we want to extract knowledge from our data and communicate information to some specific people or to the general public. A tabular report or a graph can summarize your data (possibly after having filtered and aggregated them), and communicates precise information, enriching the knowledge of the reader.
For example, you may have a MySQL table (or an Excel/CSV) file containing the orders your shop received, one row for each order. Let's say you have hundreds (or thousands, or millions) of records, related to the last five years; extract useful information just by looking into these data may be difficult.
A simple report that consists of aggregating orders by year and plotting the data in a line chart can already give you valuable information: you can immediately see how the sales are going, year by year.
Is DaDaBIK a PHP reports maker?
DaDaBIK is also a reports generator. DaDaBIK is much more, its' a complete low-code no-code platform that you can use to build complex Web applications, starting from your data, with little or no code. Among the various aspects covered by DaDaBIK, is the creation of reports.
The reason we use the word PHP here is just because DaDaBIK is written primarily in PHP (+ Javascript) but this is probably not very important for some of you: you give DaDaBIK some data to work on, you set some parameters and you get your report; the programming language we used to develop DaDaBIK might be completely irrelevant to you, in fact you can surely create no-code reports, i.e. you don't need to know any programming language to create a report with DaDaBIK. If you know some SQL, this can help you for creating more complex reports, but it is not needed to create PHP graphs or PHP pivot tables.
Is DaDaBIK a MySQL reporting tool?
DaDaBIK can certainly uses MySQL as a data source, but it is not limited to it. It supports four different relational RDBMSs (MySQL, PostgreSQL, MS SQL Server and SQLite) and other data sources (see Data Source Definition later)
How can you create a report with DaDaBIK?
Typically, the process consists in three steps:
- Define your data source
- (Optionally) filter and aggregate your data
- Produce the (tabular or chart) report
- (Optionally) embed your (auto-updatable) report into a Web page
Data Source Definition
DaDaBIK can use data coming from your relational database: MySQL, PostgreSQL, Microsoft SQL Server and SQLite are supported. So, for example, if you want to create a MySQL report (a report based on the data you have on your MySQL database), you tell DaDaBIK the credentials needed to access your DB and then you can proceed with the other steps. Any table or view can be used as a source for your report; if you want to build a report based on a SQL query, you can create a (SQL-based) VIEW in DaDaBIK and then use the VIEW for your report.
DaDaBIK can also import data from an Excel, CSV or ODS file. The import process is very simple and you can also synchronize your data with an Excel/CSV/ODS file: if during the import process a row already exists, the existing record will be updated, otherwise the row will be inserted as a new record.
(Optionally) filter and aggregate your data
Before creating a report, you may need to filter your data. For example, if you have a sales table containing the entire archive of the orders you received, you may want to consider only the last two years and only the orders coming from a specific geographic region. You can filter the data to be used in your report in two different ways: using a search form or, if you have the skills, writing the filter in SQL. Here is an example of a search form automatically created by DaDaBIK, based on a table customers of a MySQL database:
Video 1: Filter your data using search forms
Very often you also need to aggregate your data, for example you could group your sales by year. Again, you can do it using a graphical interface or by writing the corresponding SQL query. Here is an example:
Video 2: Aggregate your data using the graphical interface or SQL
Produce the (tabular or chart) report
Here we are. You can now produce your report. You first choose between tabular (pivot) report and chart report. If you choose chart, you can set the dimension and the type: Bar chart, line chart, Pie chart or Doughnut chart.
Charts are created using the popular Chart.js Javascript library so if you want you can easily customize the look of your graphs.
Finally, you can apply functions to your (aggregated) data, such as sum(), count() or statistical functions such as average, variance or standard deviation. Here we plot a graph: a 800x400px line chart showing the number of orders per month received
Video 3: Set your preferences and produce a chart
Here, instead, we create a Pivot Table starting from our products table: for each brand, we show the number of products in our catalogue and the sum of the items available in our warehouse.
Video 4: Set your preferences and produce a pivot table
(Optionally) embed your report into a Web page
You can embed your tabular or chart report into a Web page just by copying and pasting the embed code provided by DaDaBIK. You can then easily create dashboards composed by several embedded reports.
Video 5: Embed your report into a Web page
Is the report auto-updatable?
Yes, and that's quite an advantage respect to other platforms that don't offer this feature. Once you embed your report into a Web page, every time the page is reloaded, DaDaBIK re-build the report using the latest version of the data. So for example if you open a page containing a Sales by month report and you refresh the page after few minutes, if, in the meantime, a new sale has been added to your database, then the report changes.
Can I protect my reports? Can I assign permissions so that user X sees some reports and user Y some others?
Sure. For each page, data table or view in DaDaBIK you can assign different permissions to different user groups. To see a report embedded into a DaDaBIK application, the user must have read permissions both on the page and on the data table/view the report is taking data from. You can also grant the needed permissions to the public user; in this case a user does not need to log-in to see your report; this is typically what you want to do if you want to embed your report into an external Web site.
Can I export my data to Excel or other platforms?
In case you want to export your data to share them or to create your reports using another platform, you have several options:
- You can export your data (after having applied a filter, if you need) to CSV
- You can let other applications filter and consume your data via the DaDaBIK HTTP API (here you can see an example: https://youtu.be/5s8ssw3uIu8, we created a graph in Python by using data coming from a DaDaBIK Web application)
- You can share your database credentials with other applications so they can directly access the database
Ready to try DaDaBIK?
Download DaDaBIK now or Contact us to talk about your needs (we'll get back to you within a few hours).
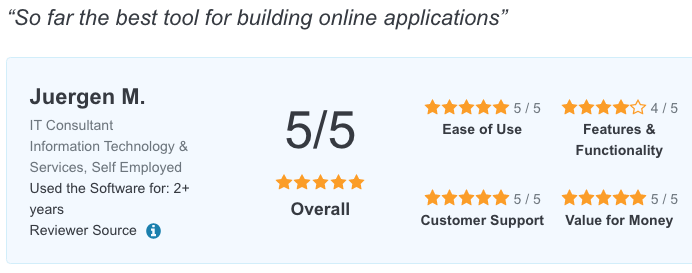
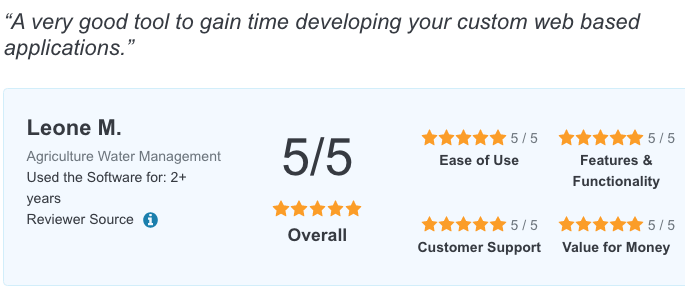
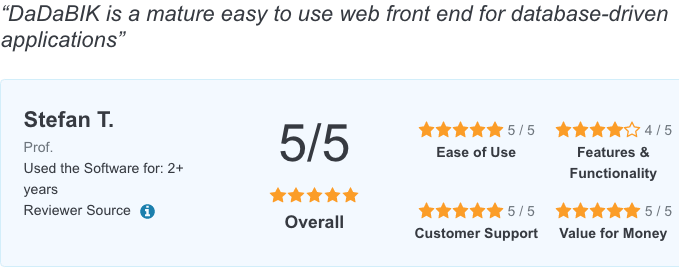
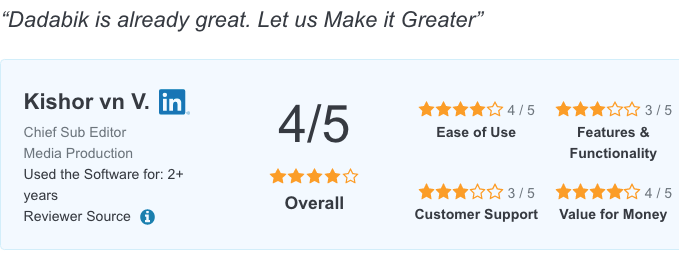
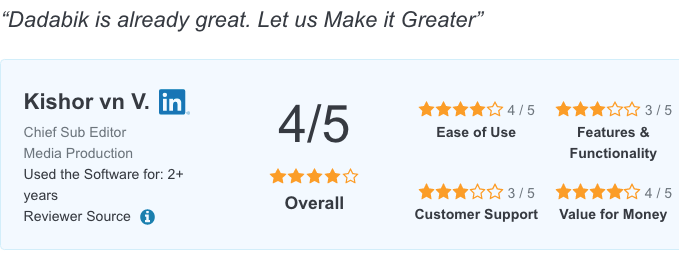
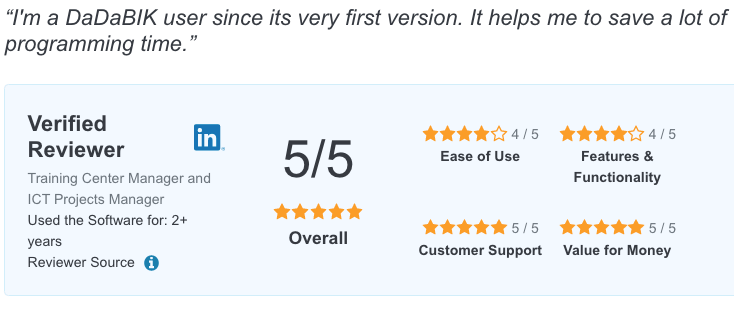
Want to know what users say about DaDaBIK? Check the reviews
Questions about using DaDaBIK as a PHP reports generator or about DaDaBIK in general? Contact us, and we'll be in touch.
